Advertisement
Our company offers solutions for monitoring broadcast and streaming infrastructure:
Our specialized stream generation solutions allow broadcasters to create an unlimited number of streams with different music and information content.
Contact us if you would like to learn more about our solutions or tell us what you would like to improve in the existing monitoring or stream generation. Moreover, feedback from users of our open source solutions is always welcome.
Introduction
Google Analytics is a freemium web analytics service offered by Google that tracks and reports website traffic [Wikipedia].
Icecast is a streaming media (audio/video) server which currently supports Ogg (Vorbis and Theora), Opus, WebM, AAC and MP3 streams. It can be used to create an Internet radio station or a privately running jukebox and many things in between. Icecast is very popular streaming engine for the radio broadcasters. Many commercial radio stations are using the Icecast server for the streaming distribution not only for the main terrestrial audio signal but also for custom Internet-only streams.
Grafana is a multi-platform open source analytics and interactive visualization web application. It provides charts, graphs, and alerts.
Application Scenario
As an example, take a mid-size radio station broadcasting in 5 different cities with a main live program complemented by the regional news and advertising. Suppose, it is a broadcasting station in the FM and DAB+. Moreover, this radio station provides the live streams for every region and additional custom streams in Internet. Each custom stream has its own musical content and is provided in 3 different versions:
- Music Only
- News, Traffic and Music (regional)
- Full program (regional)
All streams have the regional advertising and Internet listeners should get the regional advertising according to their geographic location.
All Internet streams are distributed via 3-5 different servers in dependence of the user load.
The main goal of this example is to show how data can be extracted and presented for different user categories:
- Station management and marketing team require an overview about all relevant statistics in order to prepare a solution for the program and advertising targeting (non-real time data analysis)
- System administrators need a tool that enables to monitor and react if something is going wrong in the stream distribution (real-time monitoring)
- Program director and creatives analyse real-time audience statistics and non-real time data for station events and listener reactions
Existing solutions
There are many commercial solutions that provide custom statistics for Streaming (Icecast, Wowza, DASH/HLS) using logs, proxies or live data. The main drawbacks are:
- Necessity of custom servers
- Lack of ability to track users from the site, mobile apps with broadcast and streaming services
- Insufficient support of multi-servers and multi-streams
- High costs for licenses and support
- Management and advertisers know and like Google Anayltics or Grafana
At the moment, the most popular solutions for the traffic analysis and monitoring are:
- Google Analytics
- Custom observability platform based on a time-series database, e.g. InfluxDB and Grafana
The first version of our solution offered integration only with Icecast and Google Analytics. The second version can support any streaming platform and any analytics solution.
The further description of the implementation and configuration is specific to Google Analytics, but the same principles of building analytical reports can be used on other platforms, such as Grafana. The most significant difference between Google Analytics and Grafana is that when using local Grafana-based solutions, all data is stored locally or on cloud servers owned by the broadcaster. The second version allows to export data in parallel to multiple platforms, which eliminates the need to decide for one platform and allows to analyze data and reports in the most suitable environment.
Google Analytics and Icecast
Property configuration
It makes sense to create own properties for each stream and one property for all streams together in order to get the consolidated statistic. In this demo project we assign all variants (music only, news only, full-programm) of one music style stream to one property.
Please note that the Google Analytics has a quote about 10 Million Hits a month per Property/Account (please see this link for more information). You have to estimate your traffic and decide about the possible solutions in case of the limits violations. Check out the article “Google Analytics 10M Hit Limit: What Are My Options?” for possible solutions.
Log-files or live data?
We use the live data (stats/list clients) that are available in the XML/JSON format from streaming servers or generated from custom proxies.
The usage of the log-files makes sense for the detection of disconnection events and for the analysis of the actual session time. The Icecast-kh branch provides the log files (errorlog, accesslog, playlistlog) via http. Shoutcast and Wowza provide the log information via HTTP as well.
Sampling frequency
Our current solution supports the configurable sampling and Google Analytics reporting frequencies. It is possible to make the Icecast tracking in very short intervalls for the radio advertising tracking (one radio spot can be just 5 seconds long). The best solution is to integrate the radio station automation system and adjust the sampling ratio based on the air-events and not on the fixed time-intervals (or a mixed form of both). If this is not possible than the spots can be matched with spot library using audio fingerprinting and recognition technology.
Example for advertising agencies
Let’s assume that an advertiser has placed ads on several broadcast radio stations at different times and wants to track commercial traffic and listeners’ reactions. Using our broadcast monitoring solution it is possible to track all commercials on all radio stations and link them with the advertiser’s website visitors or phone system on the same analytics plattform.
Client ID and Data Privacy Restrictions
There are different options to define the client ID:
- Extract the client ID from the web-site or force user to register: for users who are listening via players (outside from your website) you can assign the custom id’s based on your generation algorithm (it is unclear if this method conforms with the personal data policies)
- Combine the client ID with the IP address: please clarify the personal data restriction rules in your area. In most cases you cannot save the IP address as user ID
- Use the client ID from a streaming server: This solution is conform to Google policies and personal data restrictions but does not allow to track the users demographics and interests. Moreover, it will be impossible to track the new/returning users on basis of Icecast ID because the new number is assigned by new connection
- Store the user’s IP hash as a client ID: it has to be clarified if this method is in accordance with the personal data laws
If you need user targeting based on the geographic location, then ip-derivatives are sufficient. If you need more precise auditorium targeting, e.g. based on age or interests, then you need to save a pointer to this information as part of the user id. Please note that the Google Analytics provides auditorium data based on own cookies that have to be set in this case (check of the conformity with Google policies is necessary).
Pages and page titles
Tracks in Icecast terms are pages in Google Analytics terms. In the current realization these are artists and song names or a titles of the program elements (e.g. news, advertising etc.). Typical radio station has about 1.000 songs in the rotation. Therefore, the number of pages is limited. It is advisable to put the mount point in the page url or in the page title in order to simplify the analyzing of different streams. In this case it will be possible to track, how often the song was played, how many listeners had heard this song. Moreover, you can track the “exit rate” of each song over time. Out tests showed that the listeners have not switched immediately the radio if the first song was not in their taste. Therefore, it makes sense to make a more complicated analysis (but it is outside of the scope of this article).
Audience configuration
Different segments can be used in order to analyze the geographic location or events. For example, following segments can be created: listeners USA or listeners Germany in order to compare the regional data with the overall listening data. Moreover, following segments can be added in order to provide the event statistics for the listeners behavior: start listening, stop listening and current listeners.
Demo
Real-Time Icecast data in Google Analytics

Icecast Real-time Locations in Google Analytics

Icecast live Events in Google Analytics
Such events could be: current listeners, start/stop listeners, AQH data or all other information that is relevant for statistics. It is not necessary that this data should be from Icecast; you can feed the events from your TV-sports advertising times in order to monitor changes of the listener behavior between campaigns. Moreover, you can set targets in order to monitor the results of some capmaigns.
Icecast Live Events

Rich hourly comparision with another day

Icecast Reach Hourly from all servers in Google Analytics
It depends on your needs how to measure the listeners. It can be cumulative, AQH or other calculations based on specific algorithms. Please note that you can generate different statistics based on the user basis using different properties. It is also possible to put all data in only one property and provide some additional data using the events.
Events generation
The event engine enables to put all additional data bases on the Event Category, Event Action, Event Label and Event Value to the google analytics. There are functions that calculate the average of the Event Values. This case demonstrates the average listener number based on the custom calculation algorithm. It is possible to generate the events from each listener or to generate the cumulative event with the calculated value.
 based on the icecast data")

Additional Google Analytics options
All Google Analytics options are available in custom reports and dashboards including data export to other tools. You can compare the auditorium from different regions and cities or how many listeners are connected from different regions during the day. As example, it was clear to see that share of the USA listeners was small during the morning hours but began to rise from 3 p.m.
Targeting programs and advertisements
After you have known your listeners with help of Google Analytics, you can develop the targeting programs for the specific listener groups or offer the targeting advertisements.
As an example, you detect the rising share of listeners from Hamburg and would like to get better positions in this region. In this case you can prepare the regional news or jingles that will be played only for Hamburg’ listeners. The same is for the advertisement, you can play the spots based on the targeting requirements. Technically, that can be done using the combination of Liquidsoap and Icecast (both are open-source products).
Integration with Dash and HLS
DASH and HLS are just another technologies for the content distribution. Therefore, it makes sense to measure all listeners of the radio station in one property.
Integration with Web-Users
It is possible to track the Web and Icecast users. Moreover, it could be possible to get the additional listener characteristics using the Google Analytics tools.
Integration with DMP/SSP
It is also possible to use this software as a part of the DMP/SSP solution. Please don’t hesitate to contact us, we can discuss the possible implementation details.
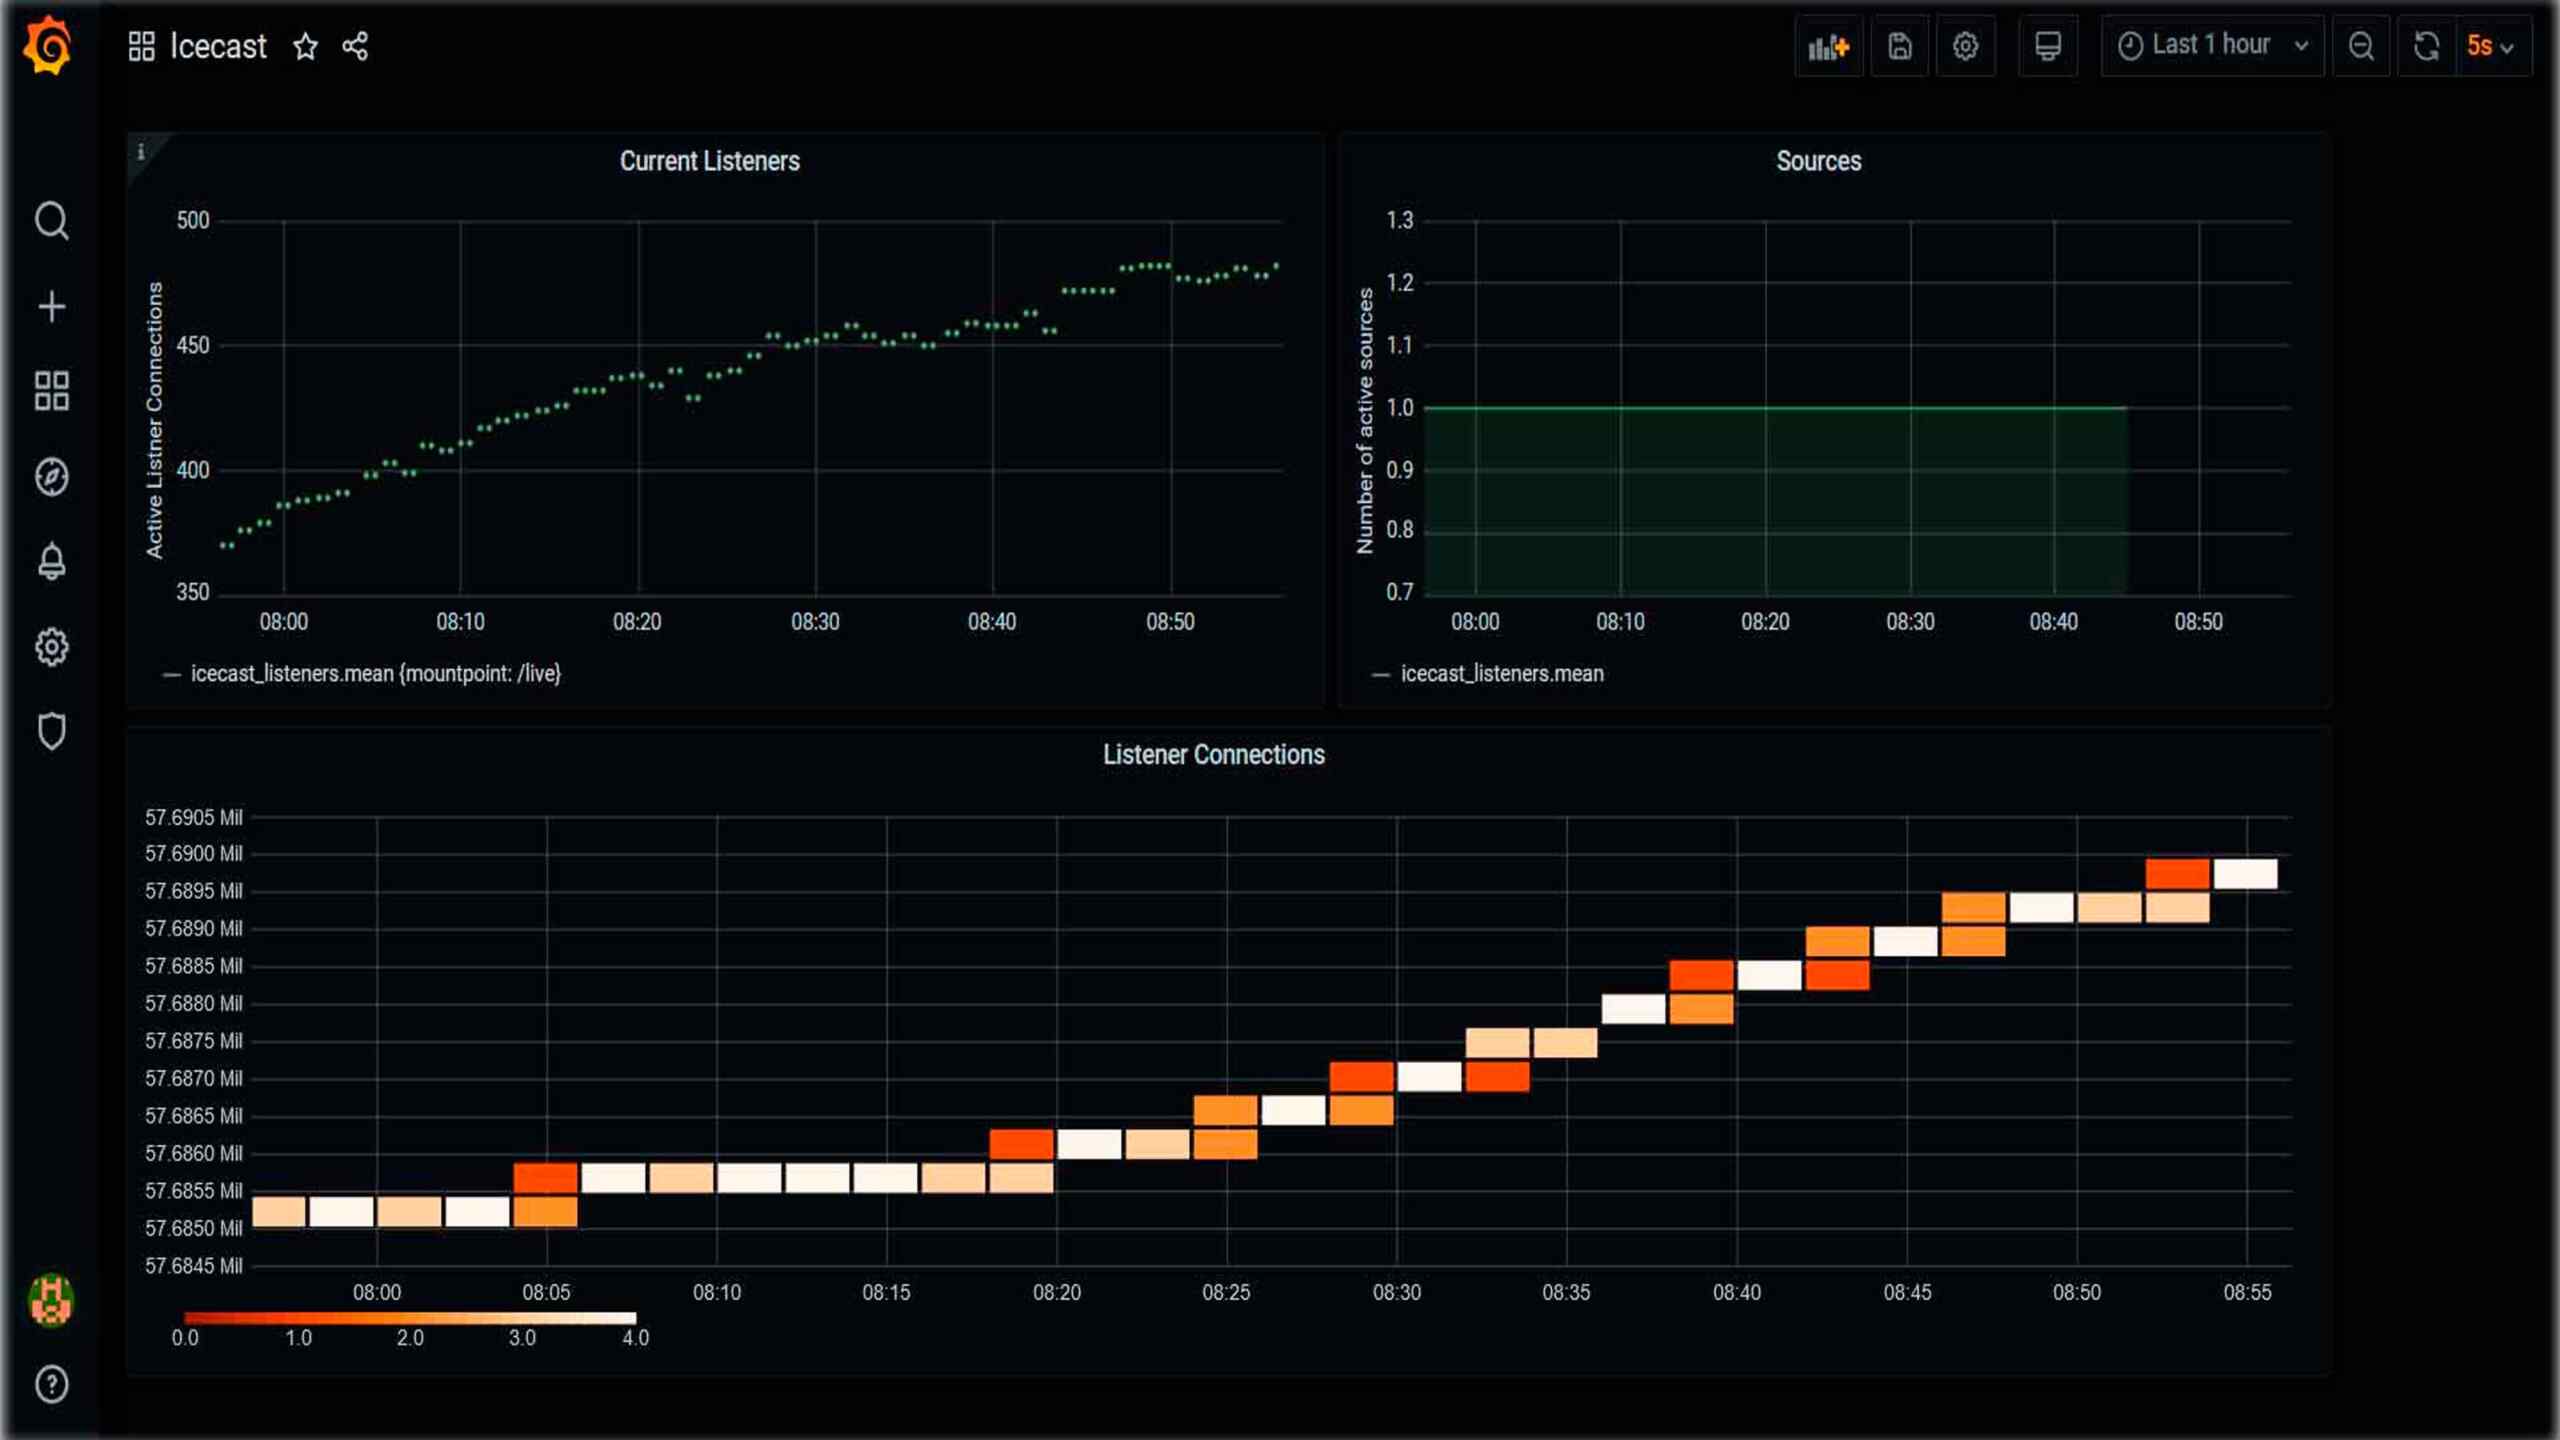
Integration with InfluxDB and Grafana
The time-serie export can be done in parallel for any time-series database. As an example, we provide an integration with the InfluxDB. The data can be visualized in Grafana or any other time-series visualisation tool.


Installation
Installation
The source code is available on GitHub (Icecast2GoogleAnalytics project).
In order to install you need following software components:
- Java8, git and maven. see maven project for more details.
- configured config.xml with your icecast and google analytics settings.
Installation and start
Version 1
git clone https://github.com/iroks/Icecast2GoogleAnalytics.git
cd Icecast2GoogleAnalytics/
mvn package
cd target
java -jar icecast2googleanalytics-1.0-SNAPSHOT-jar-with-dependencies.jar /your-path-to-config-file/config.xml
Version 2
Version 2 is a Spring Boot application. Please use branch v2 on git. You also need to install InfluxDB, Grafana and Elastic Search or prepare a docker container with all necessary dependencies. Dependencies can be started as docker containers.
Grafana: docker run -d -p 3000:3000 grafana/grafana
InfluxDB: docker run -p 8086:8086 -v $PWD/influxdb:/var/lib/influxdb:rw influxdb
Geolocation database
Geolocation database is not included in the source files due to the license restrictions (you have to register, accept the terms and download the databases). Please take a look at these posts:
https://blog.maxmind.com/2019/12/18/significant-changes-to-accessing-and-using-geolite2-databases/
https://db-ip.com/db/download/ip-to-city-lite
Please do not forget to update the path to the geo database. Geo database is not necessary if you plan to use only Google Analytics functionalities.
Using Docker
Ned Kelly created a Docker build that can be installed into your custom server or Google /Amazon infrastructure. This tool can be also used as the infrastructure monitoring and notification in cases of failures or unappropriated usage as well.
Technical Support
Please create a ticket on GitHub for any technical issues.